
Since 2018, the Visual Communication Department of the University of Art and Design Linz is cooperating with Statistics Vienna (MA 23 – Economy, Labour and Statistics) to develop their visual language for all data visualisations and information graphics as well as a design concept for the brochures “Vienna in Figures”, in which statistical data of the City of Vienna are presented. All visualisations and printed materials were developed and produced by the department’s staff, alumni and students under the direction of Tina Frank.
Visual Communication Team: Tina Frank, Sebastian Hierner, Katharina Mayrhofer, Hanna Priemetzhofer, Clemens Schrammel
Brochures (available in German and English):
- Research and Development 2018 (Hanna Priemetzhofer: Design & Typesetting)
- Business Location 2018 (Hanna Priemetzhofer: Design & Typesetting)
- Research and Development 2020 (Hanna Priemetzhofer: Design, Typesetting & Infographics)
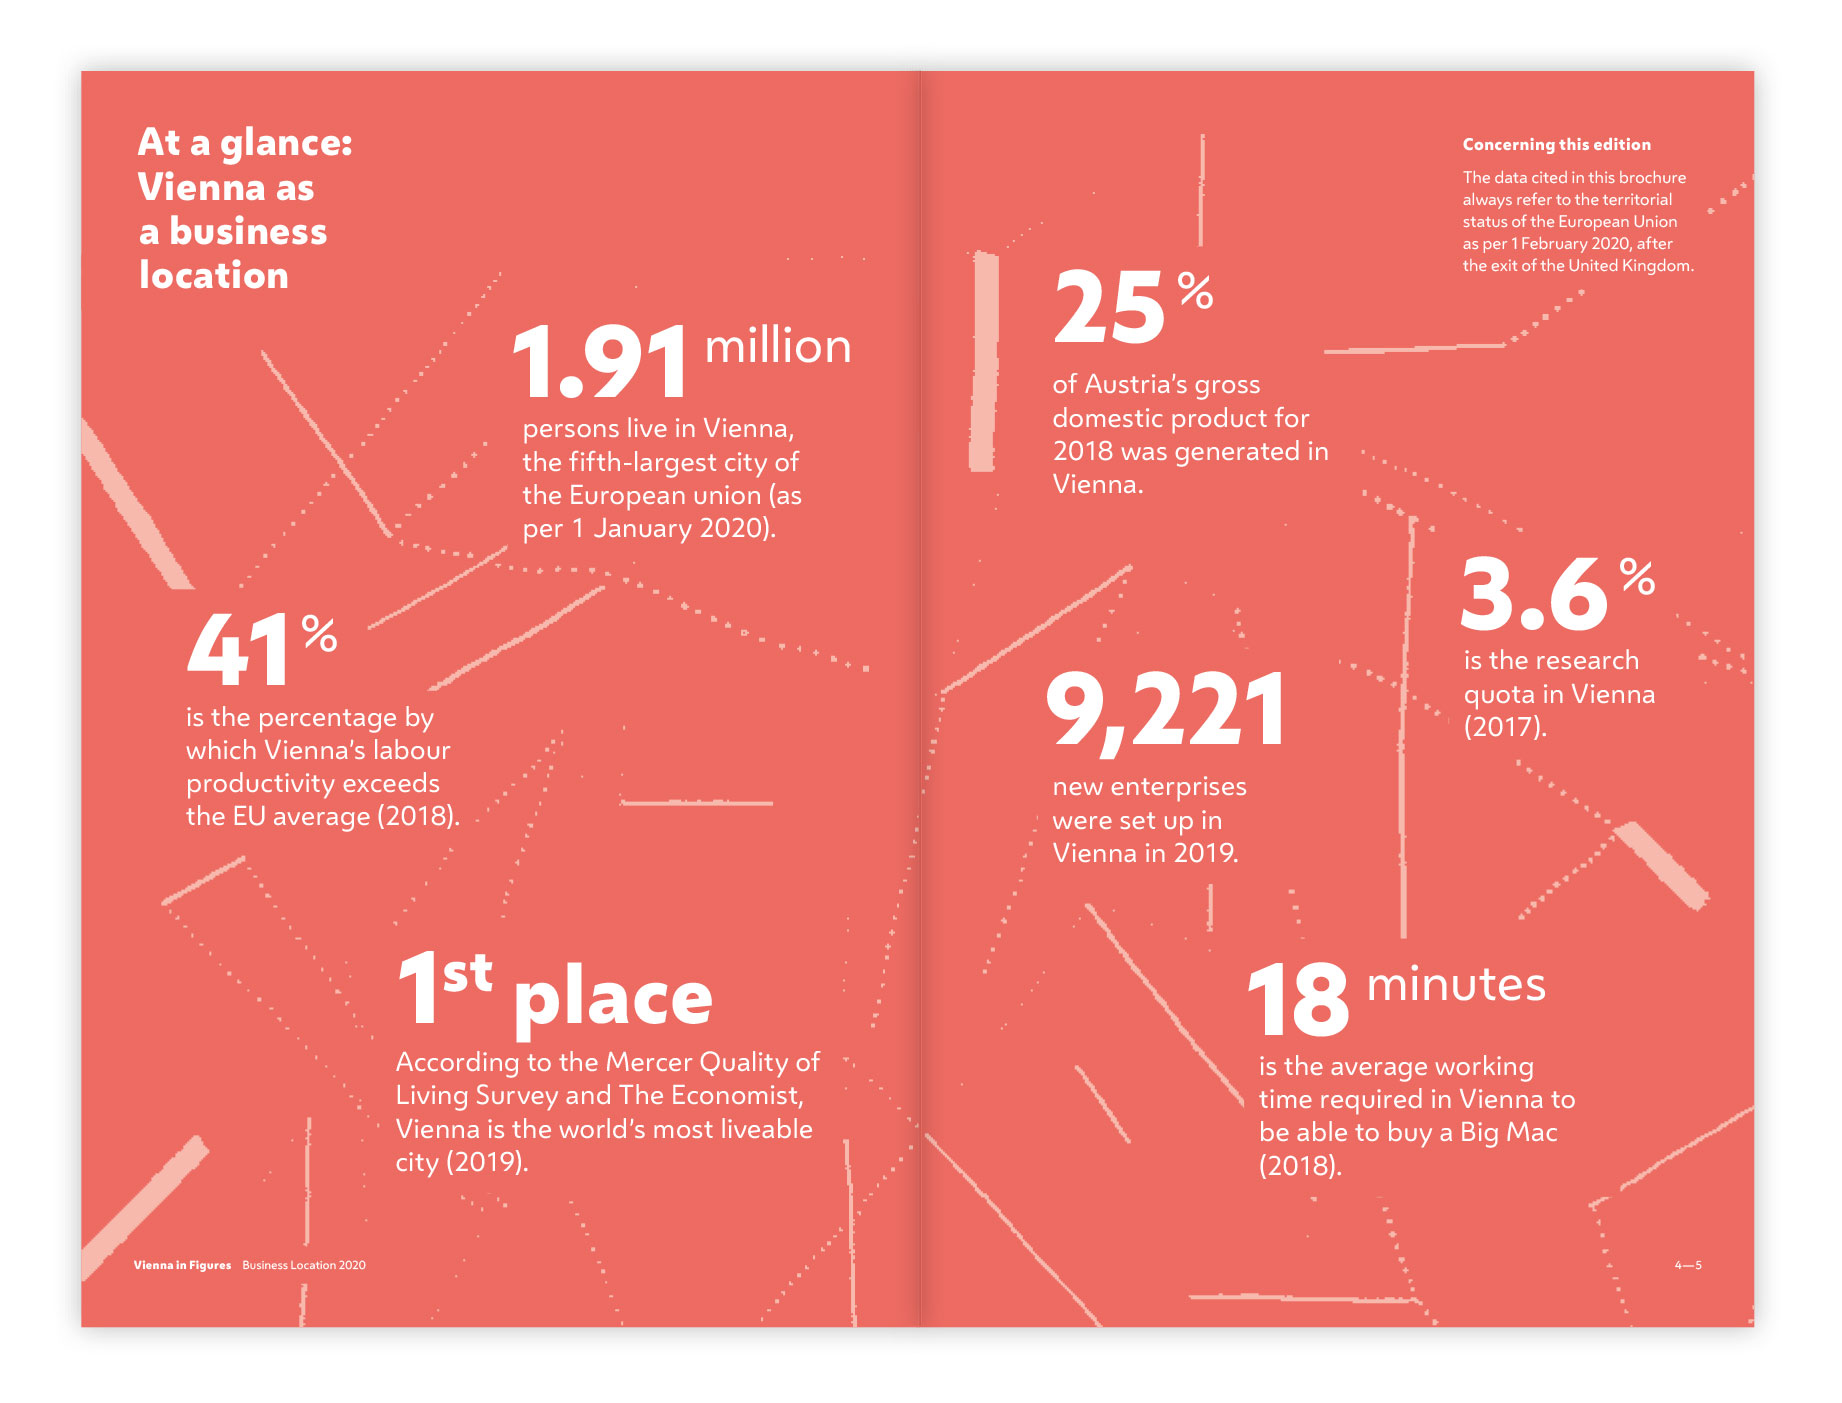
- Business Location 2020 (Hanna Priemetzhofer: Design, Typesetting & Infographics)
Poster (available in German and English):
Vienna as Business Location and Research Center (2018, 2020)
Cover:
Statistical Yearbook (Statistiches Jahrbuch der Stadt Wien) 2018–2024
In addition to printed matter we have also developed the infographics and illustrated infographics for online presentation.


2019/2020 various illustrated infographics for online use where developed for Statistics Vienna (MA 23 – Economy, Labour and Statistics), taking into account the current cooperate identity guidelines.
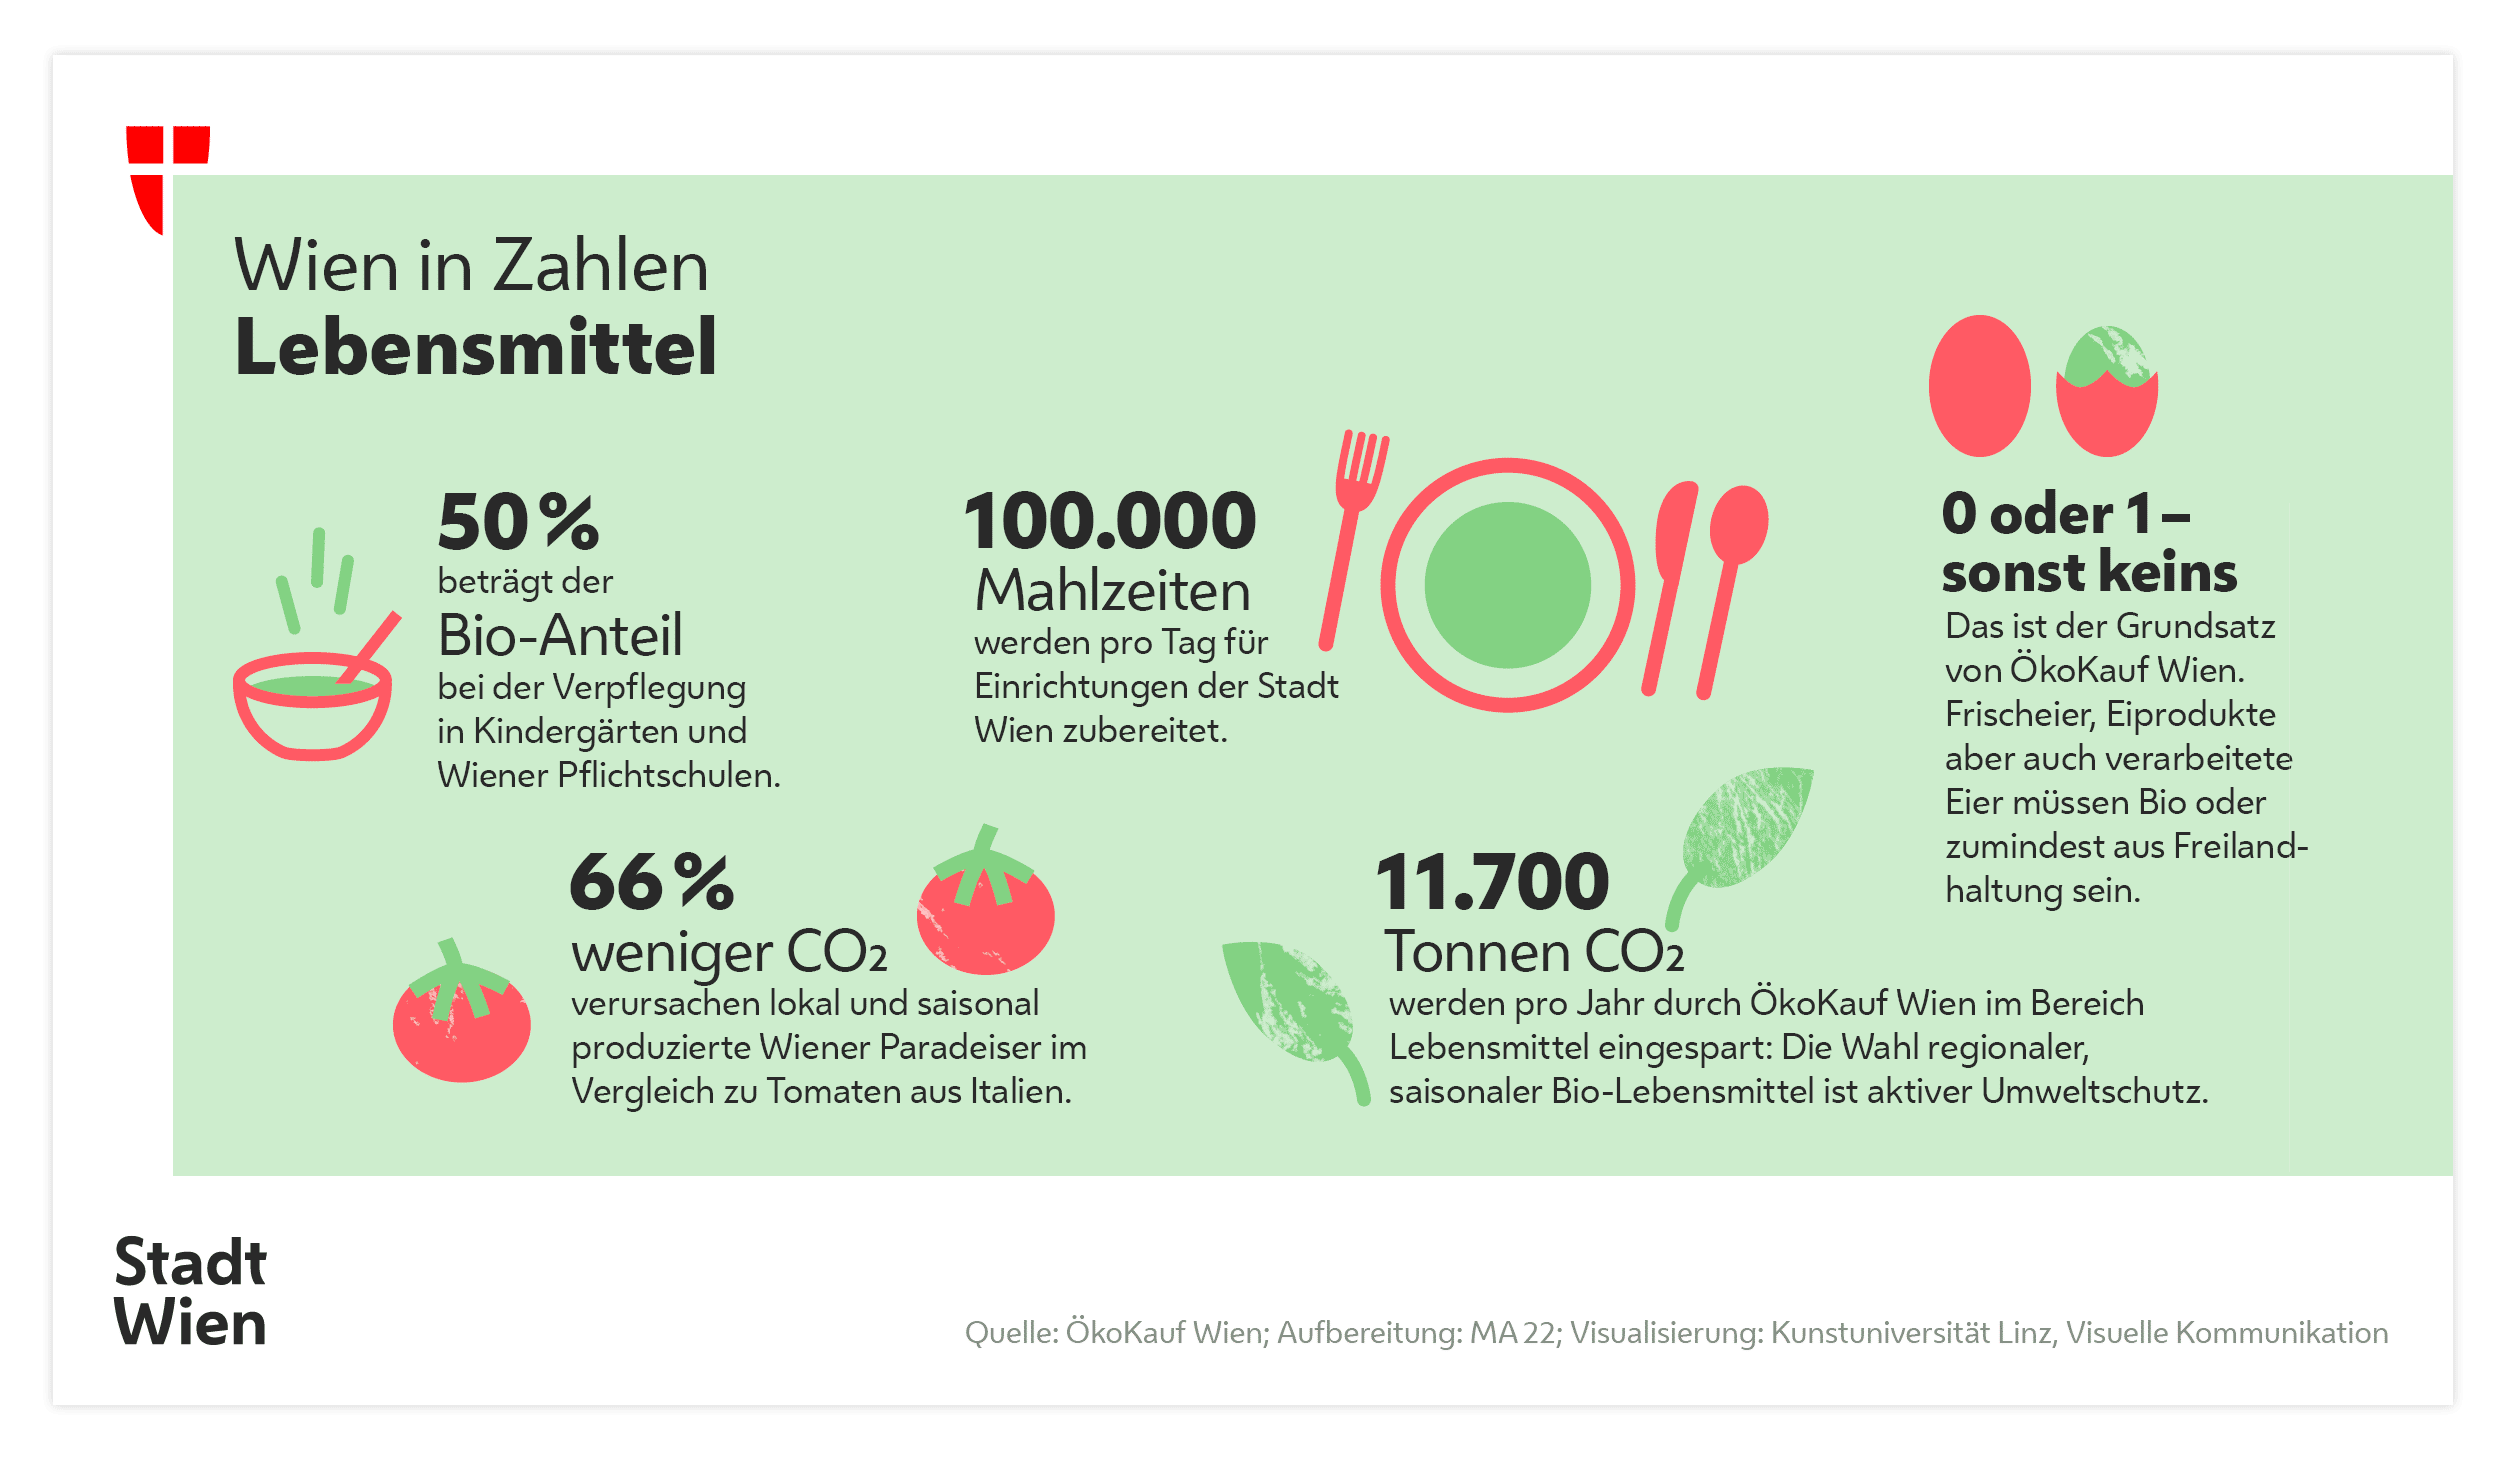
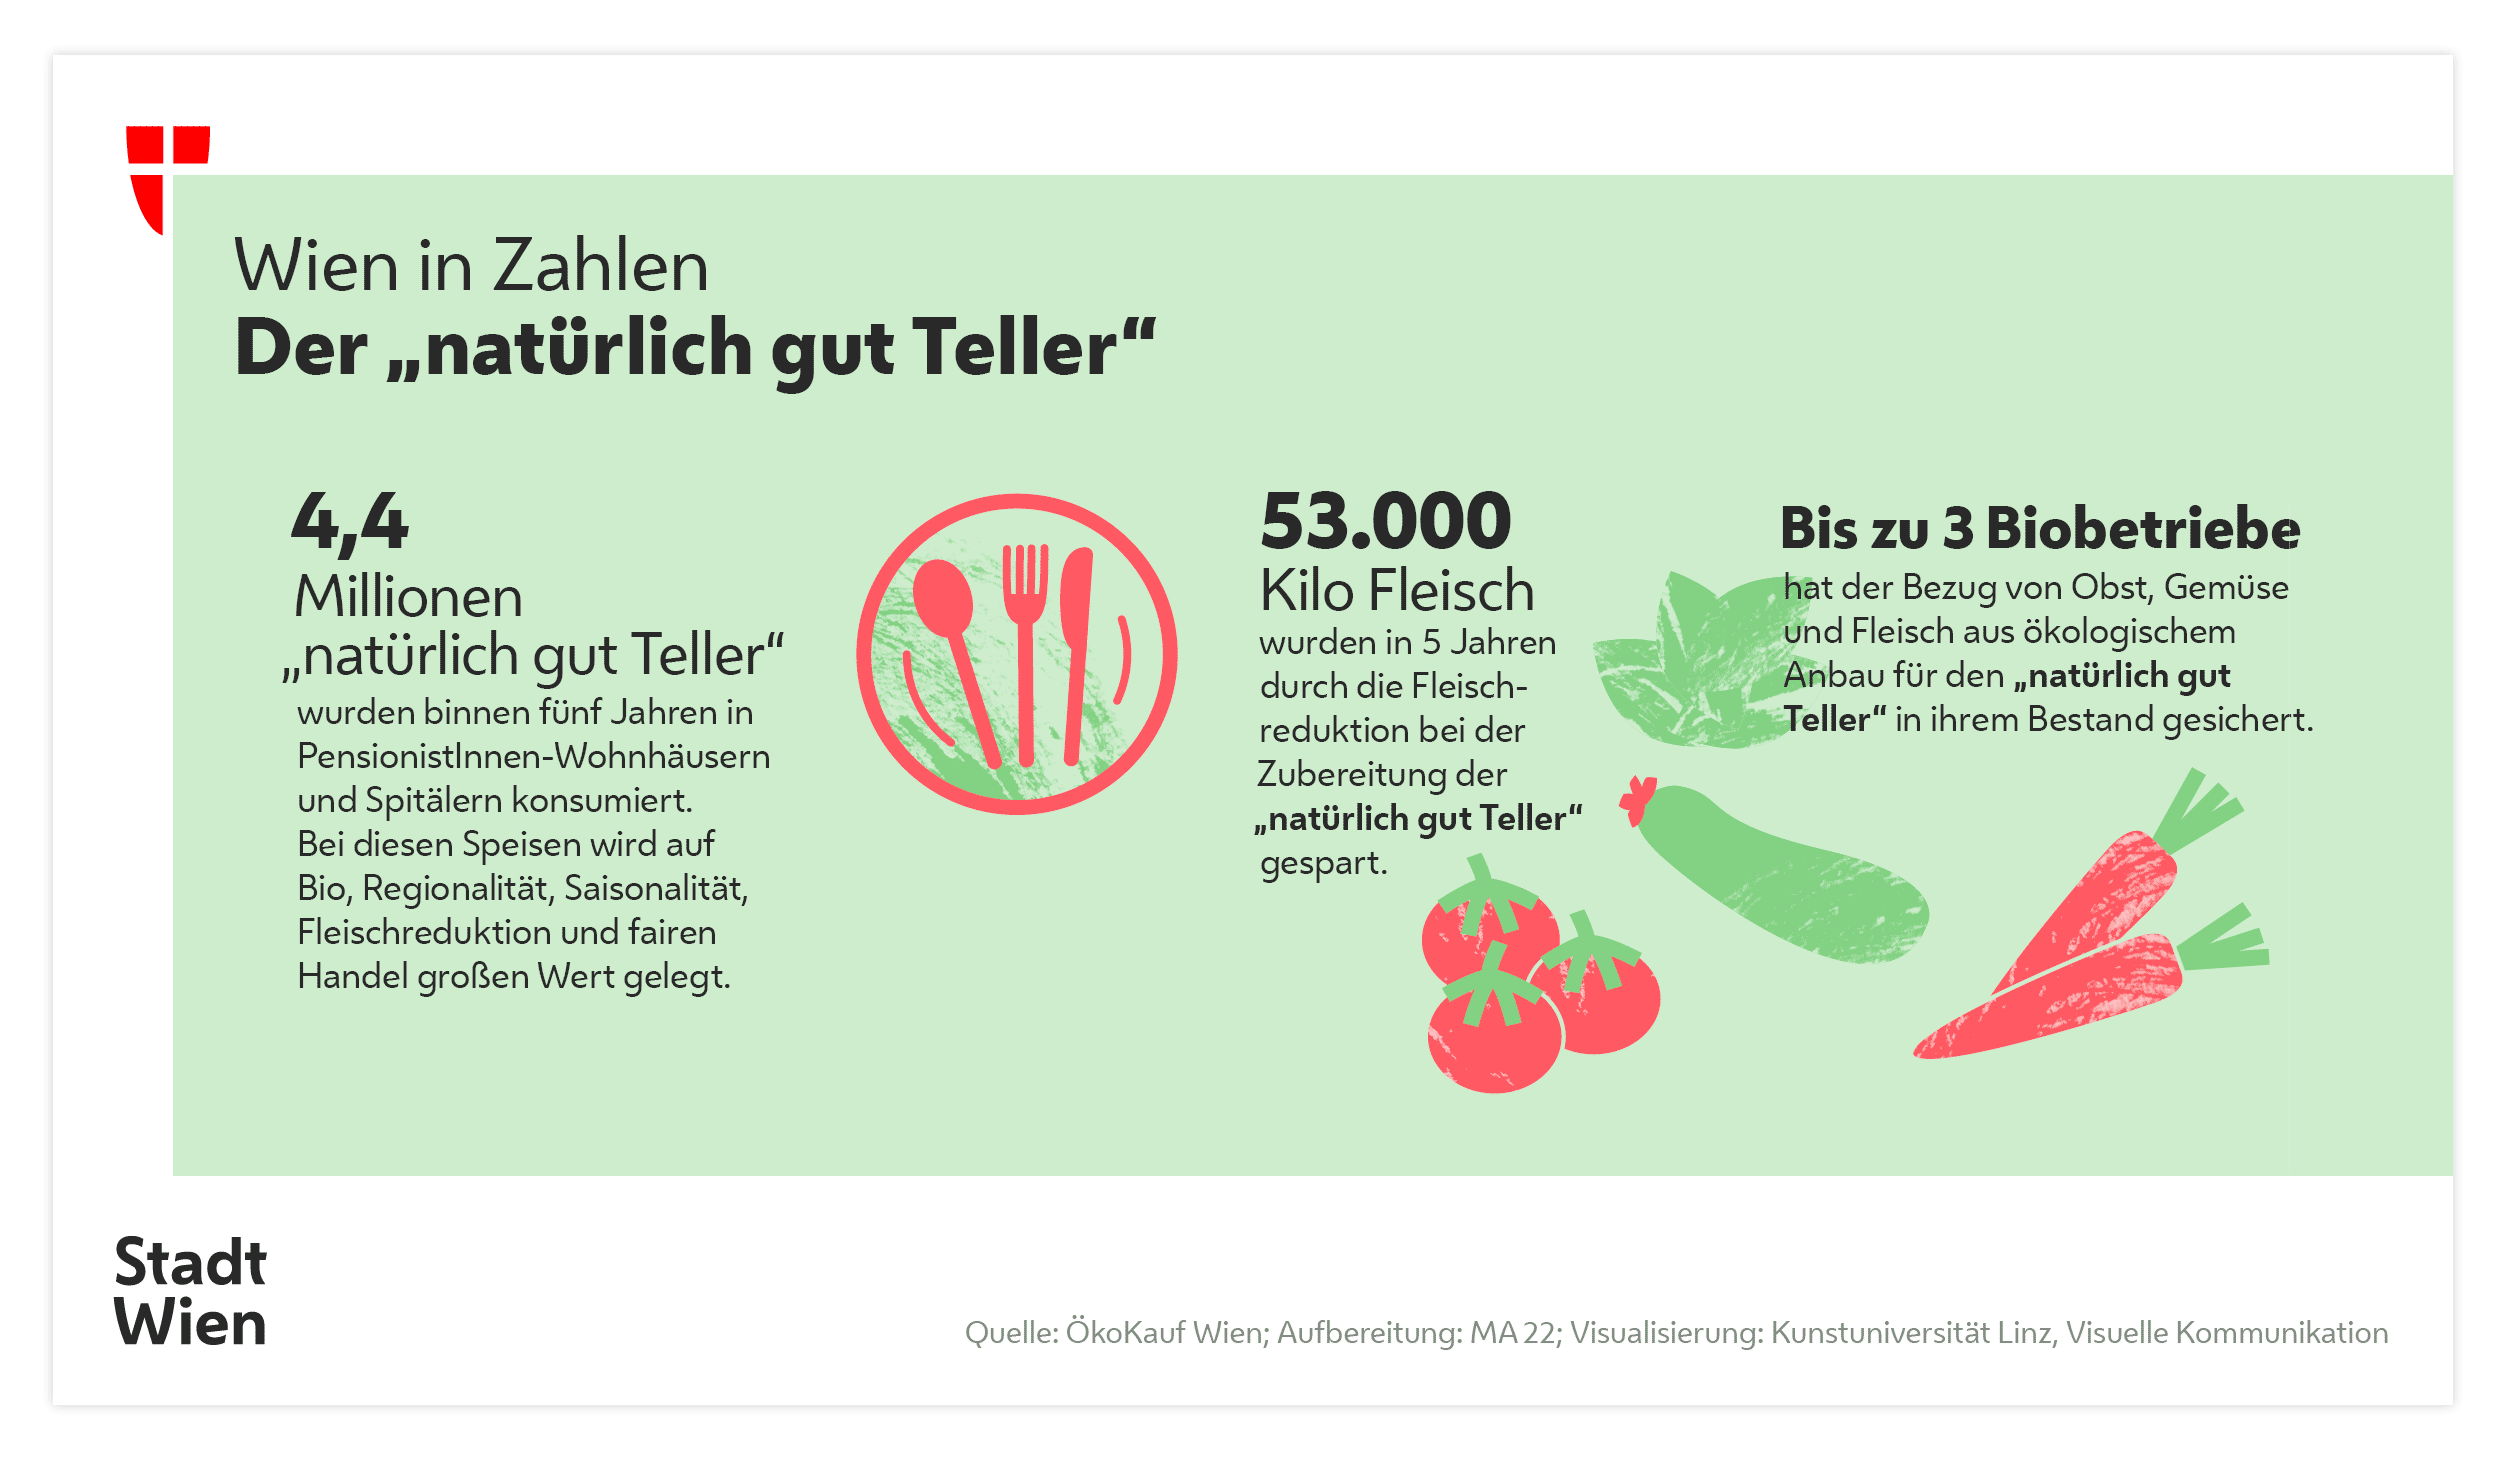
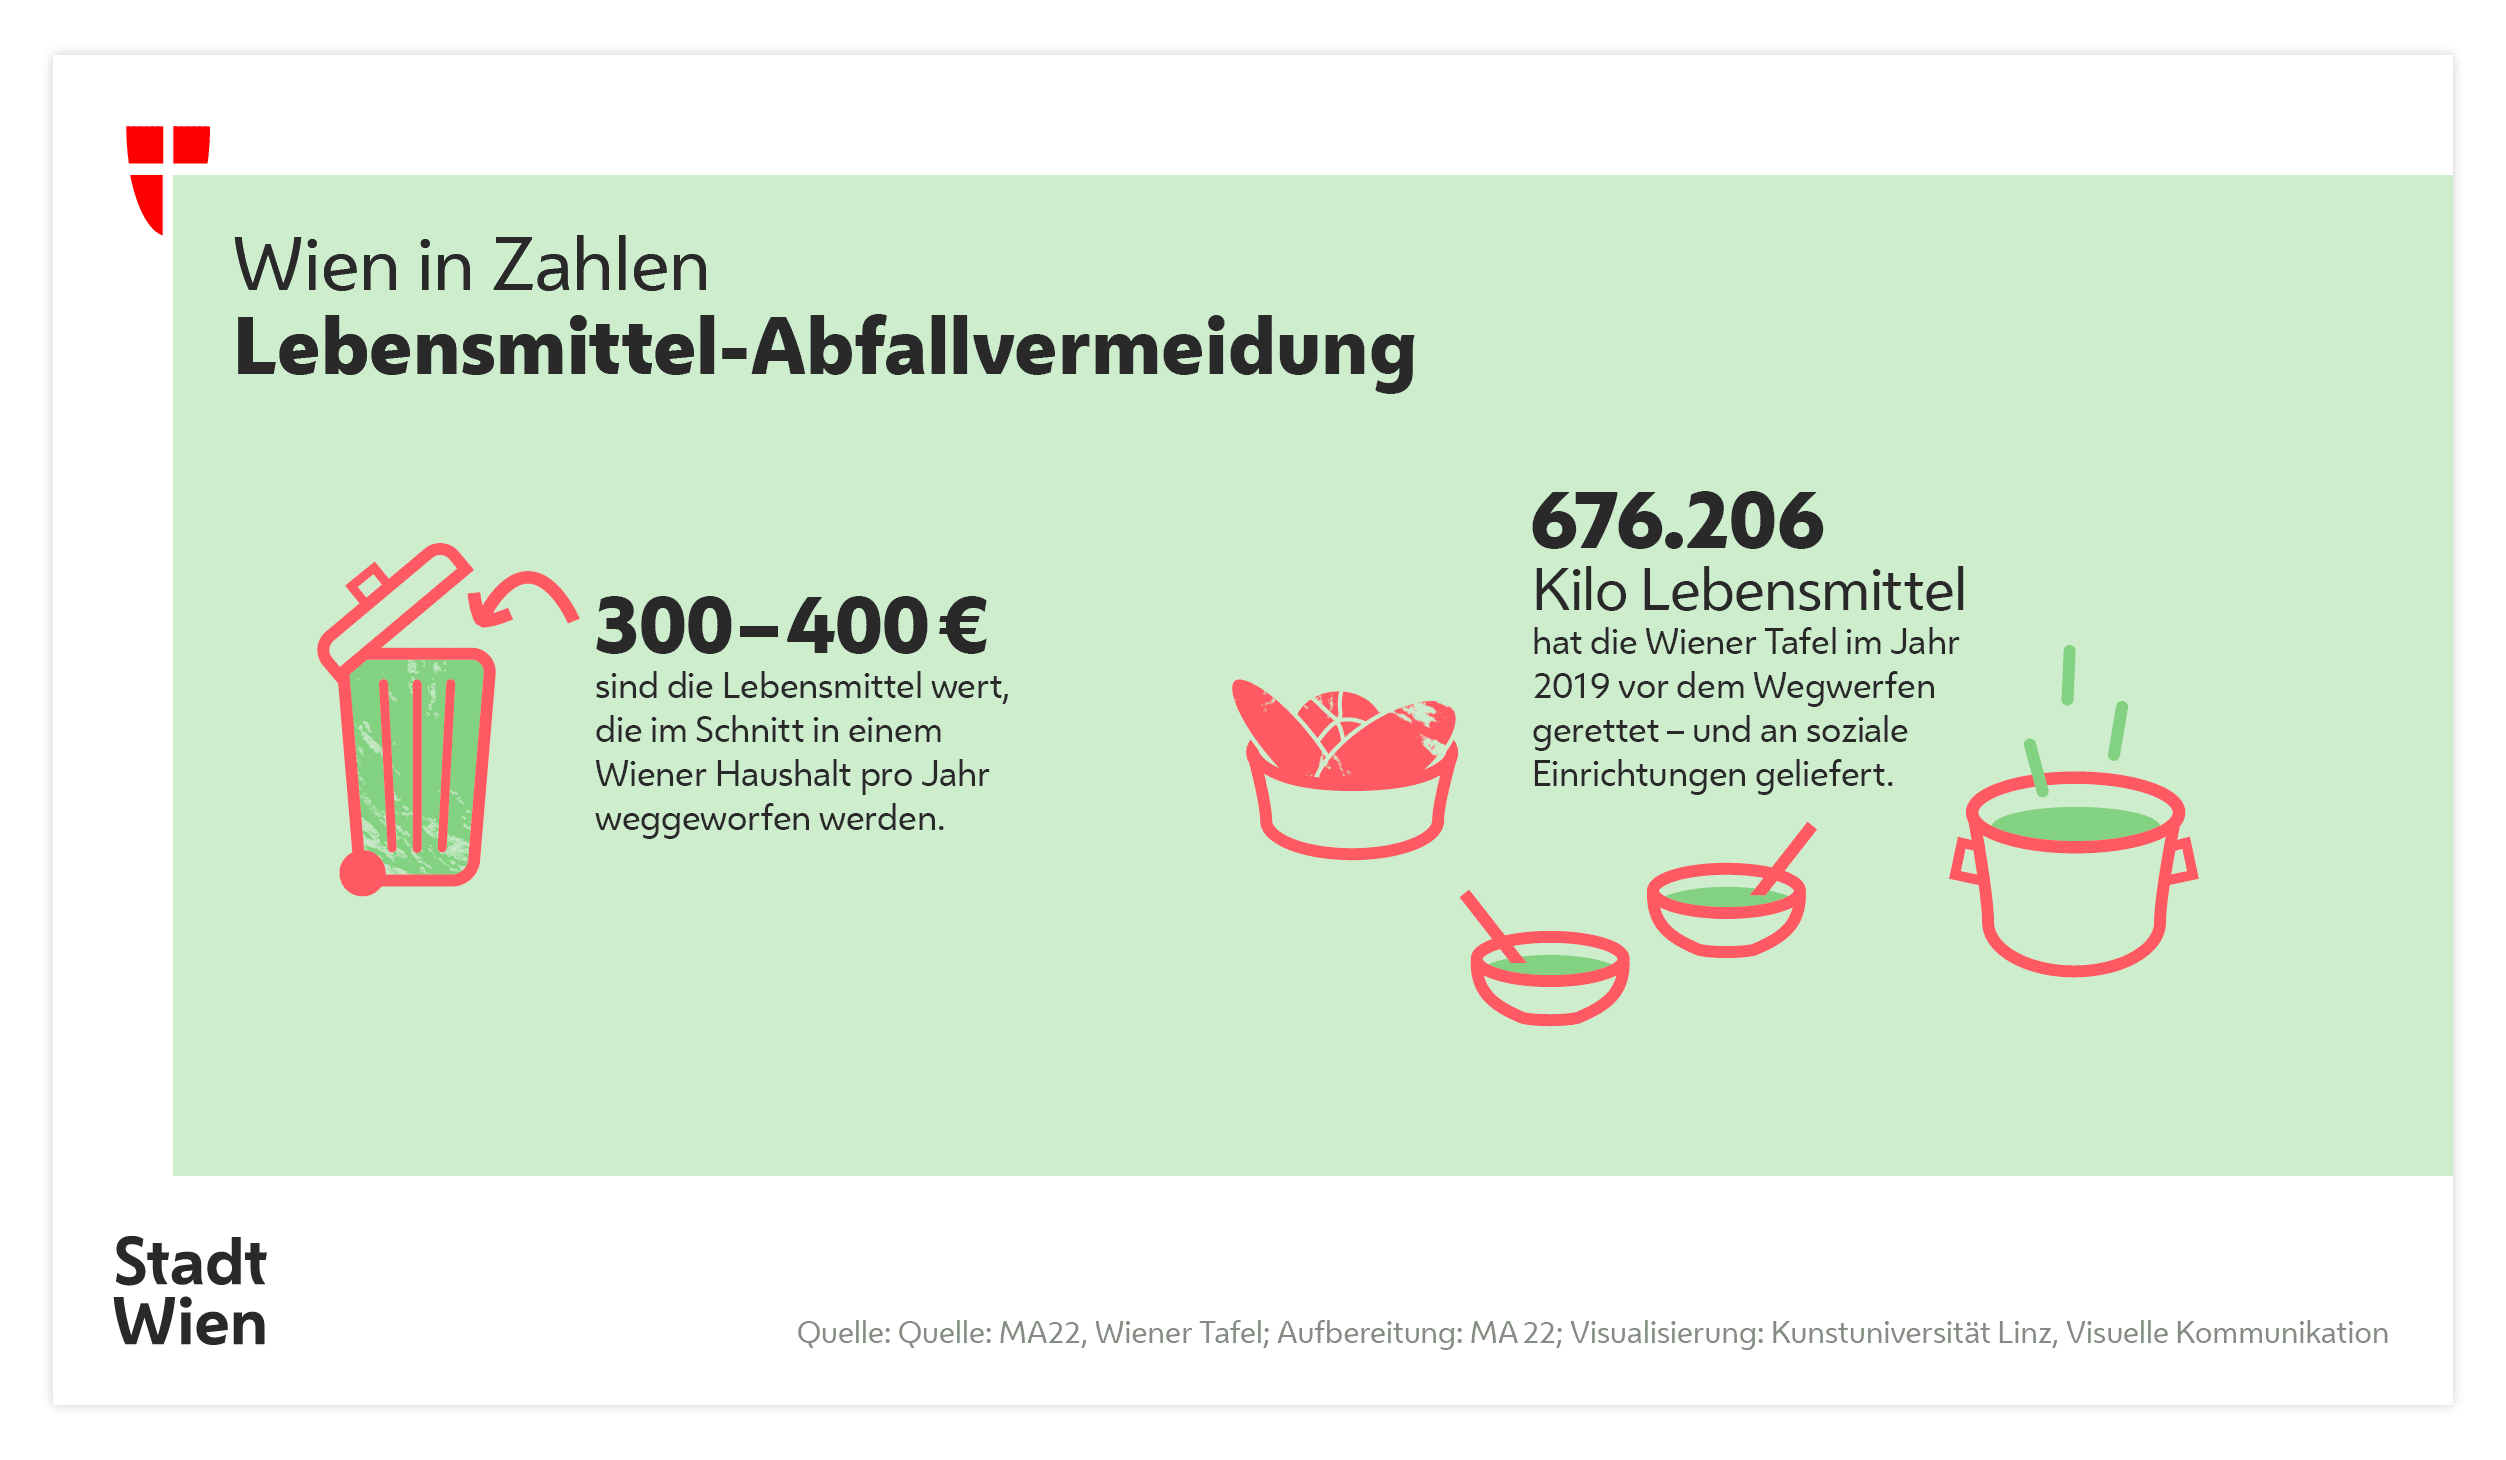
2020: illustrated infographics adressing the topic of food waste
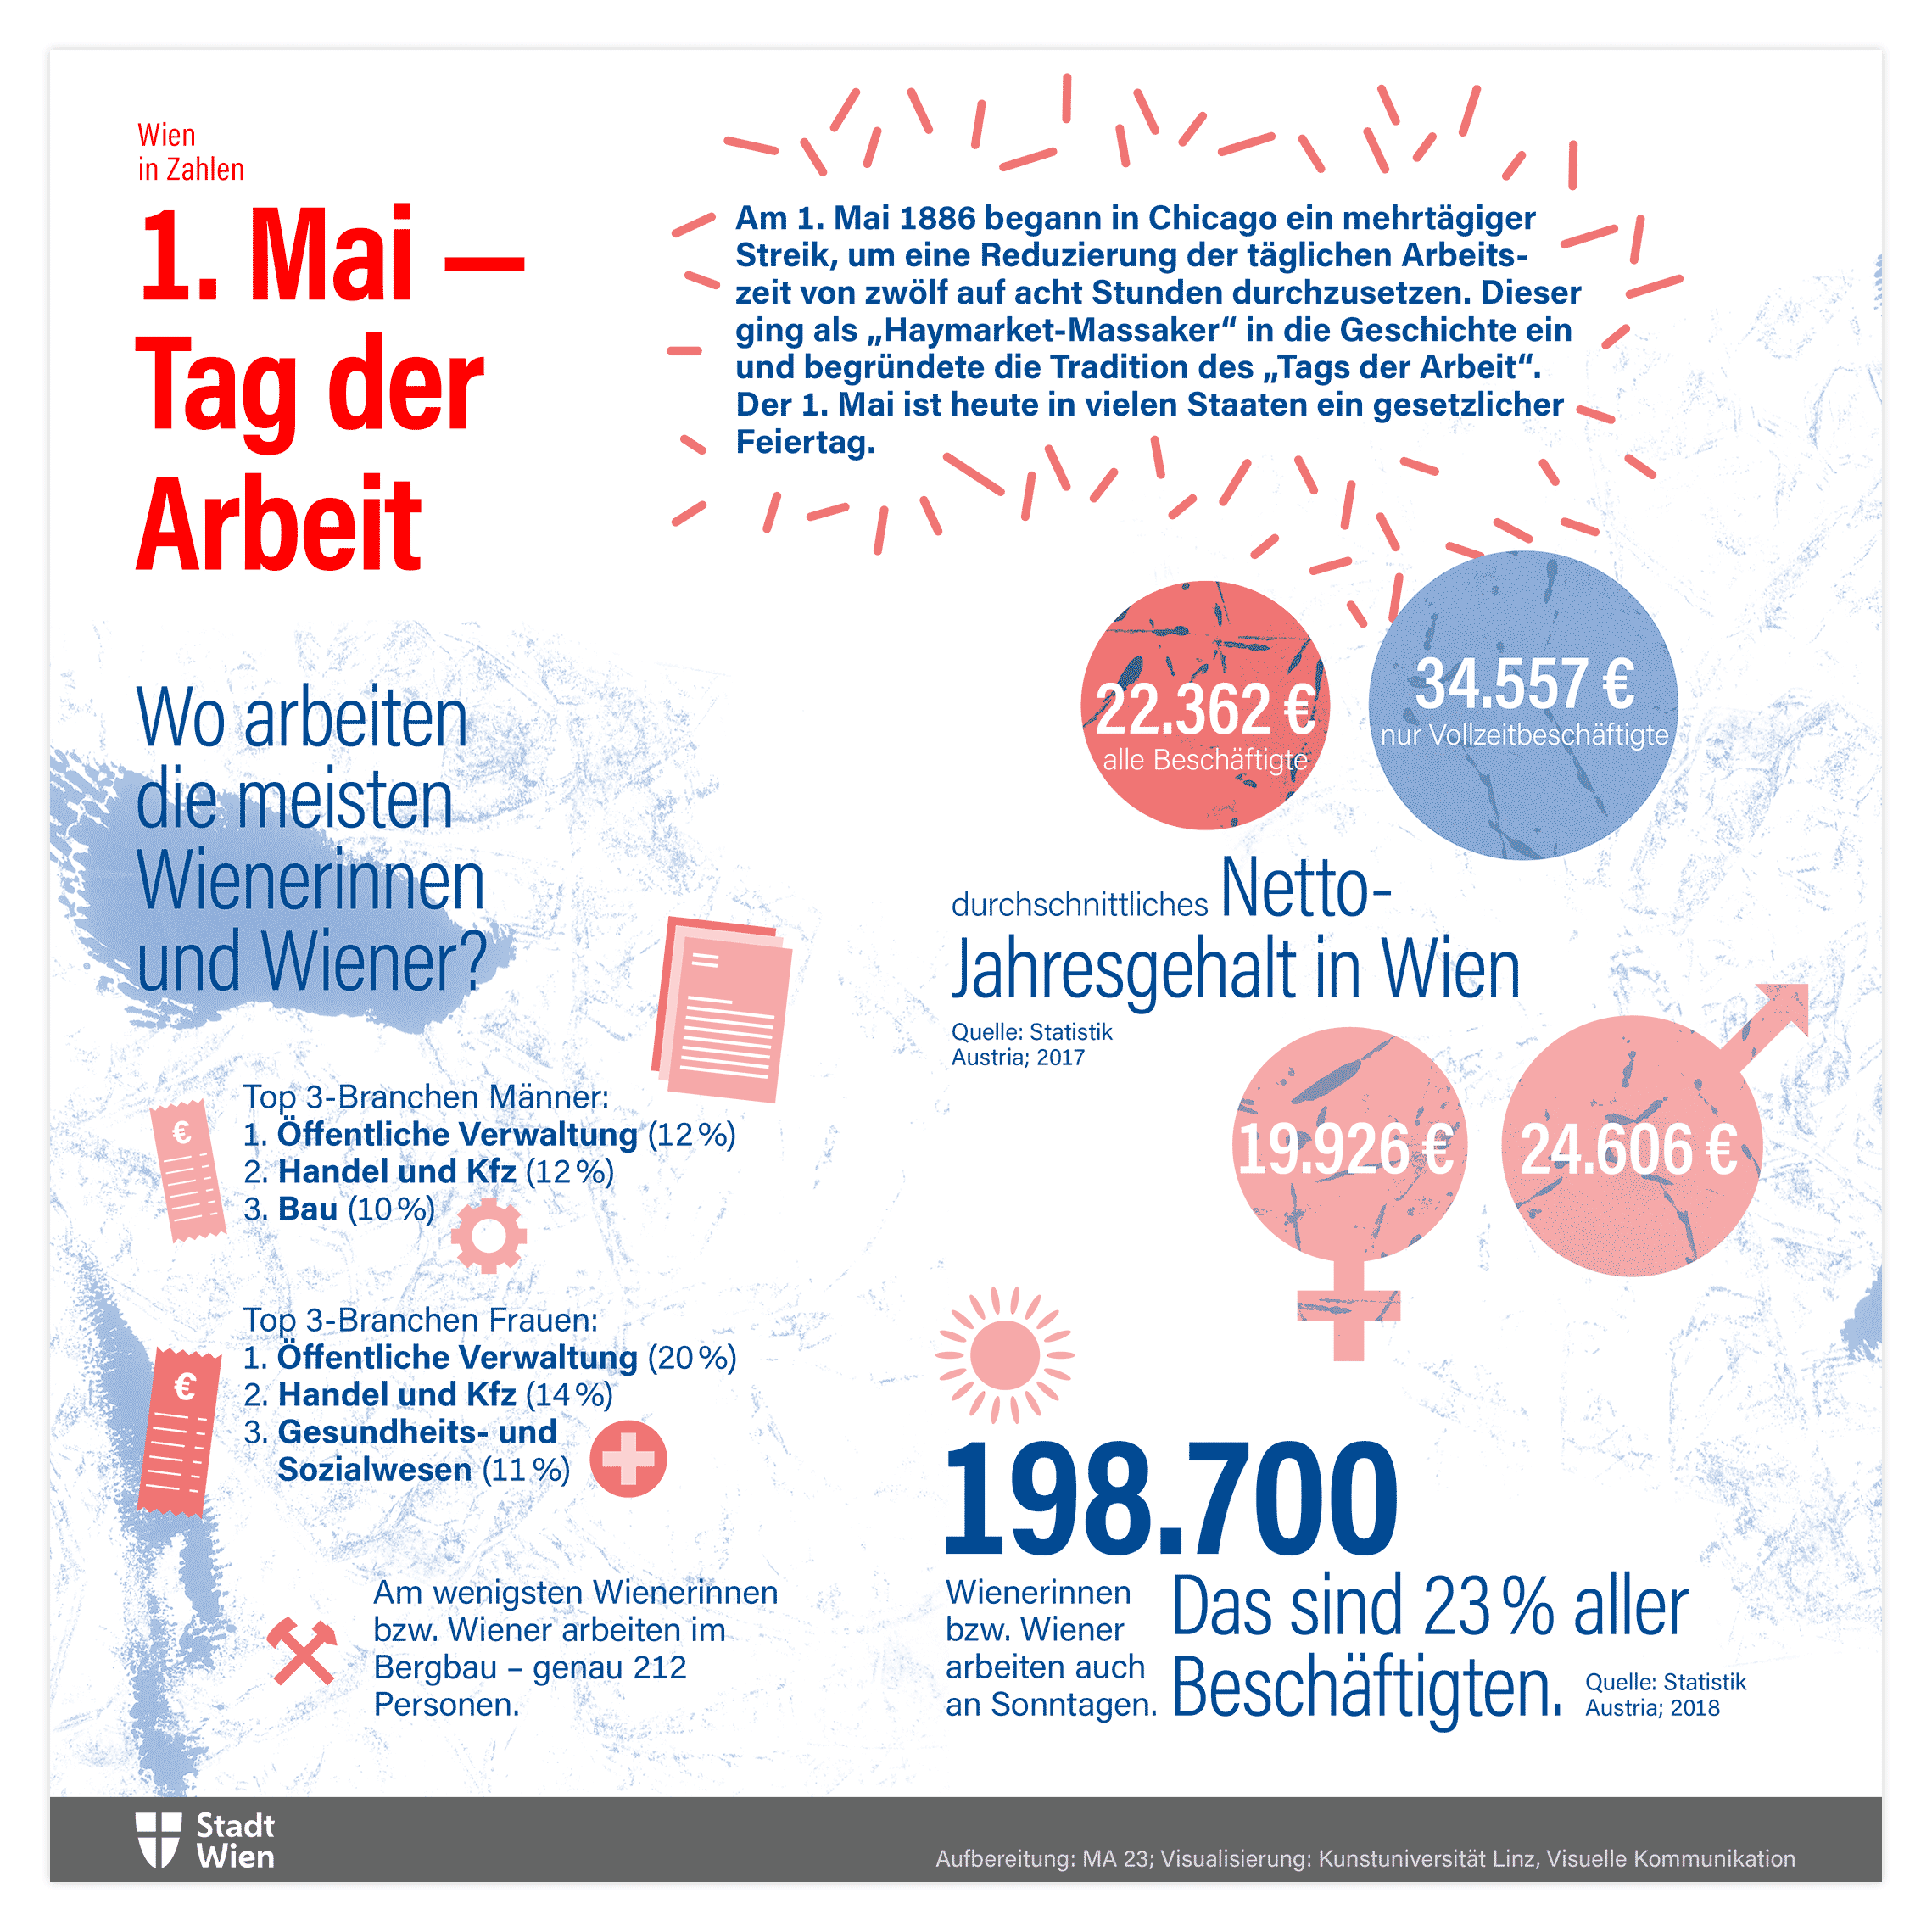
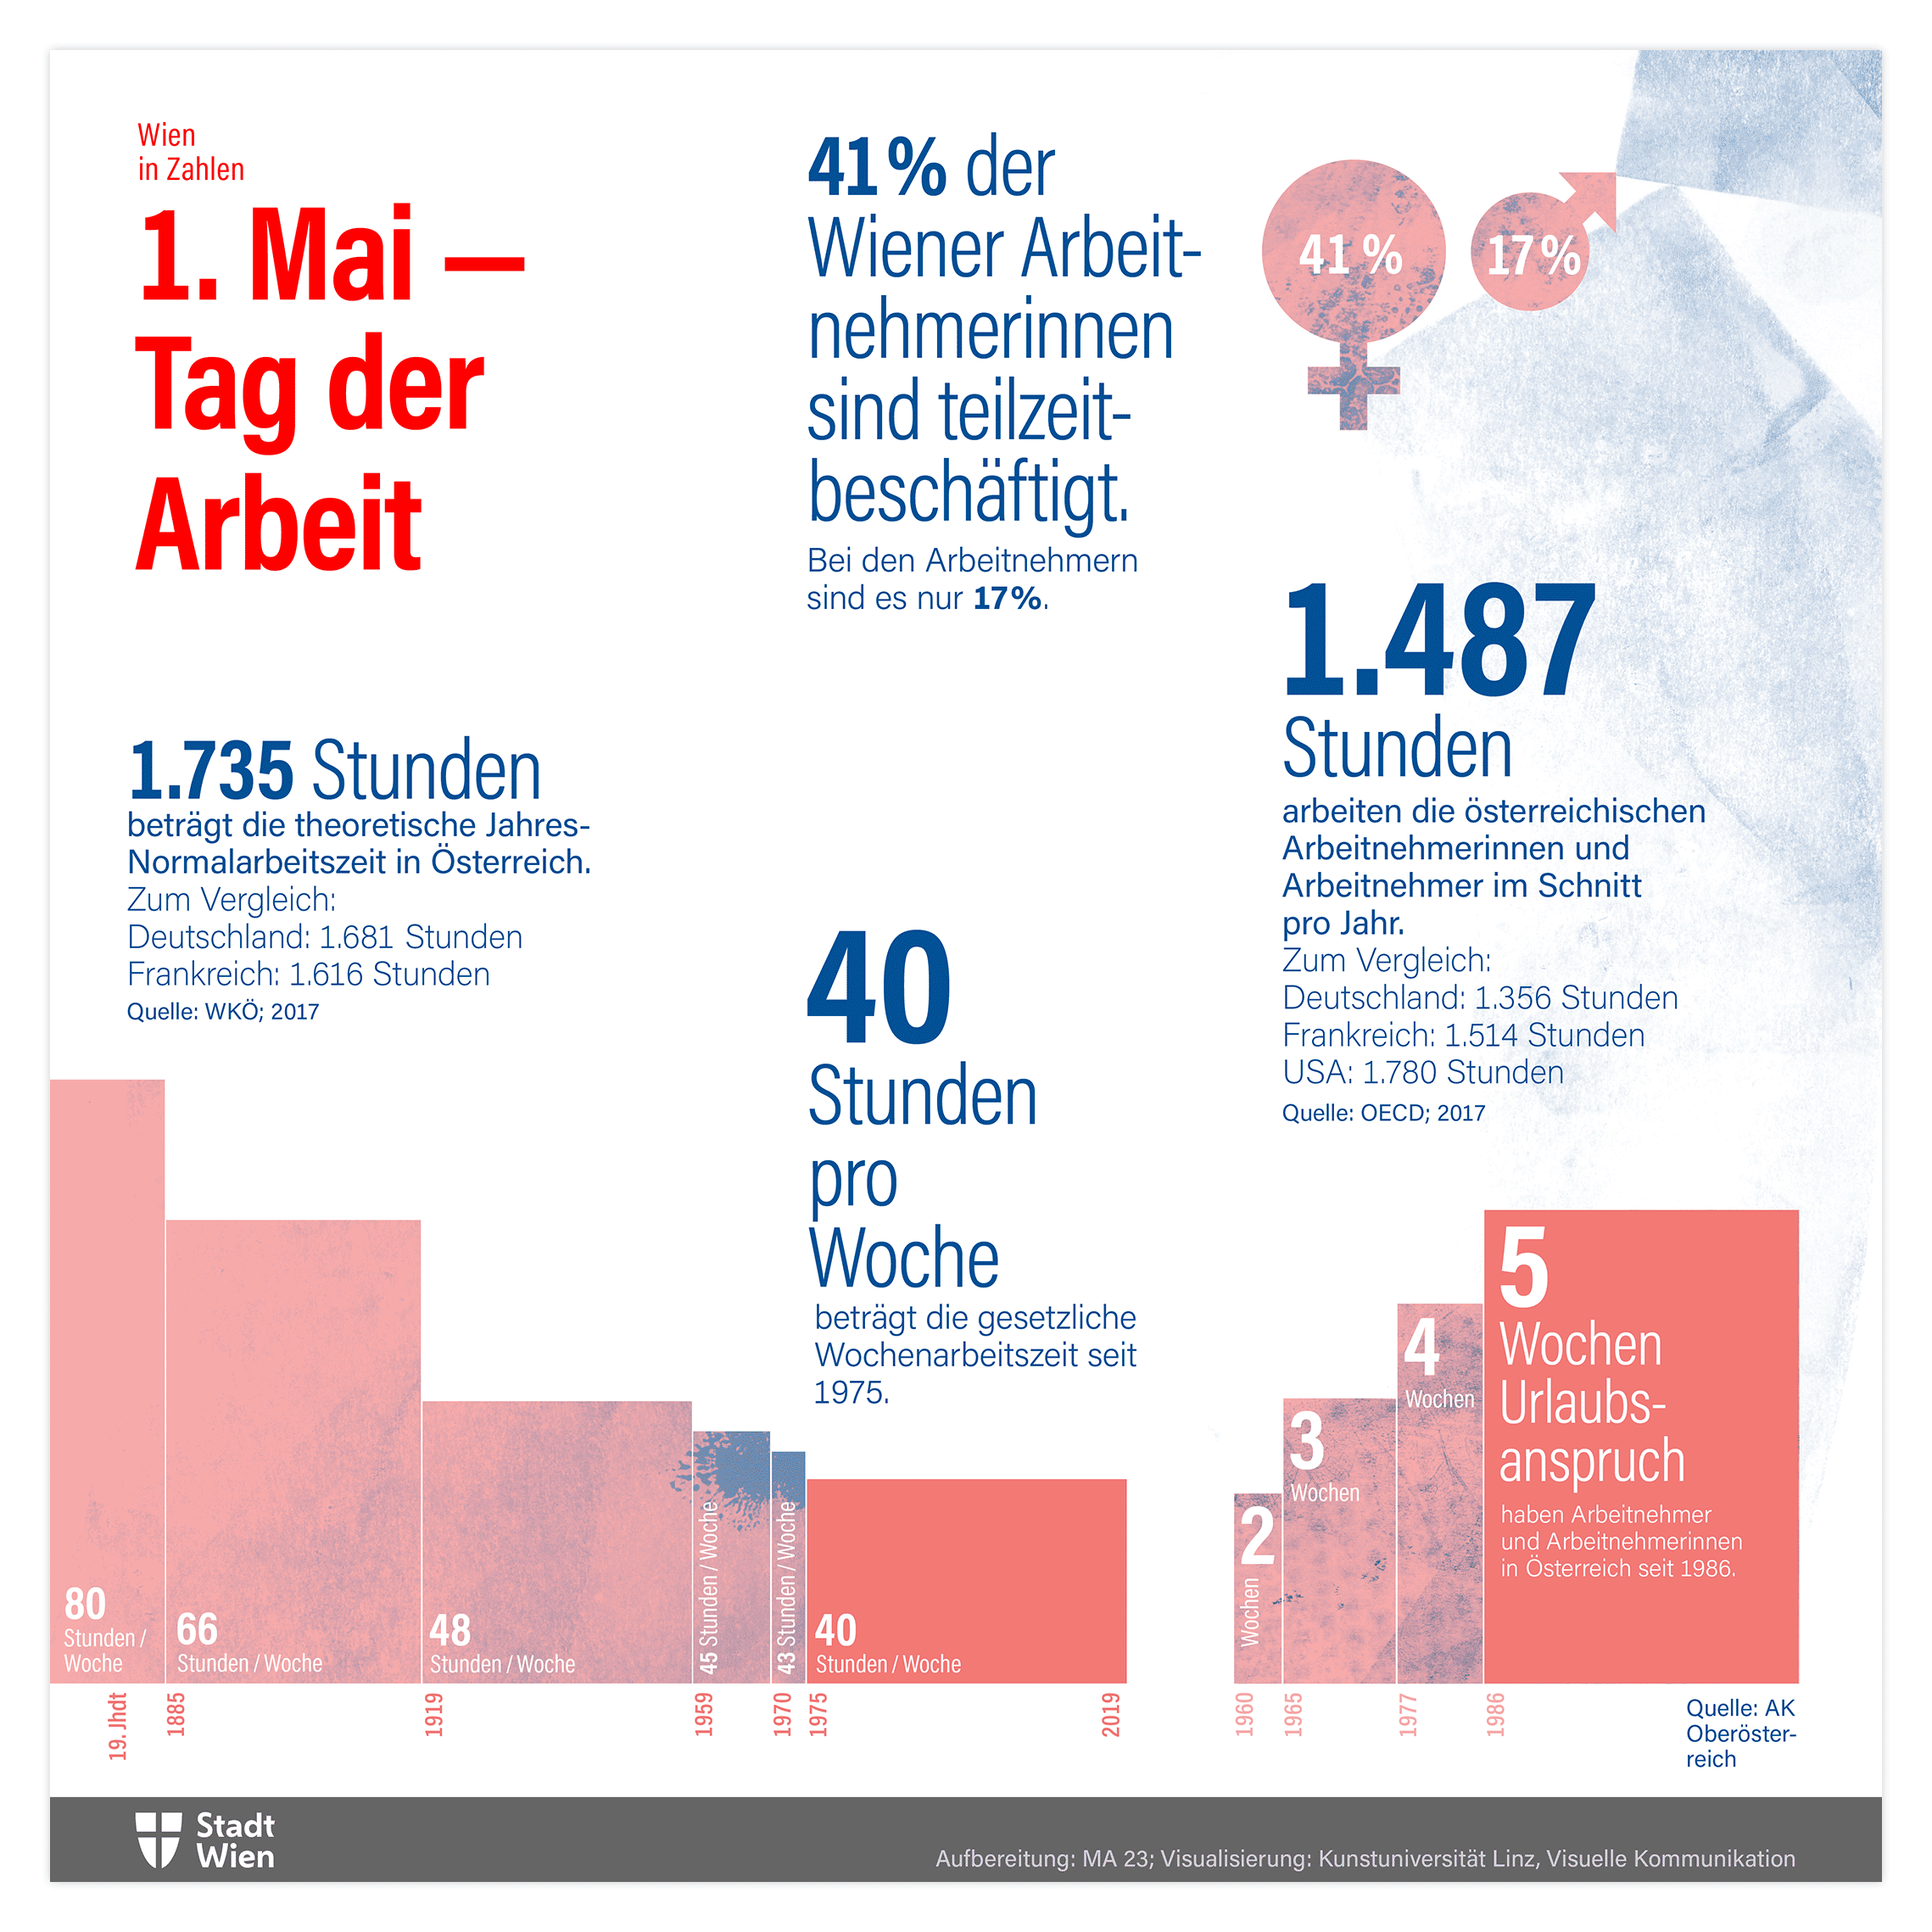
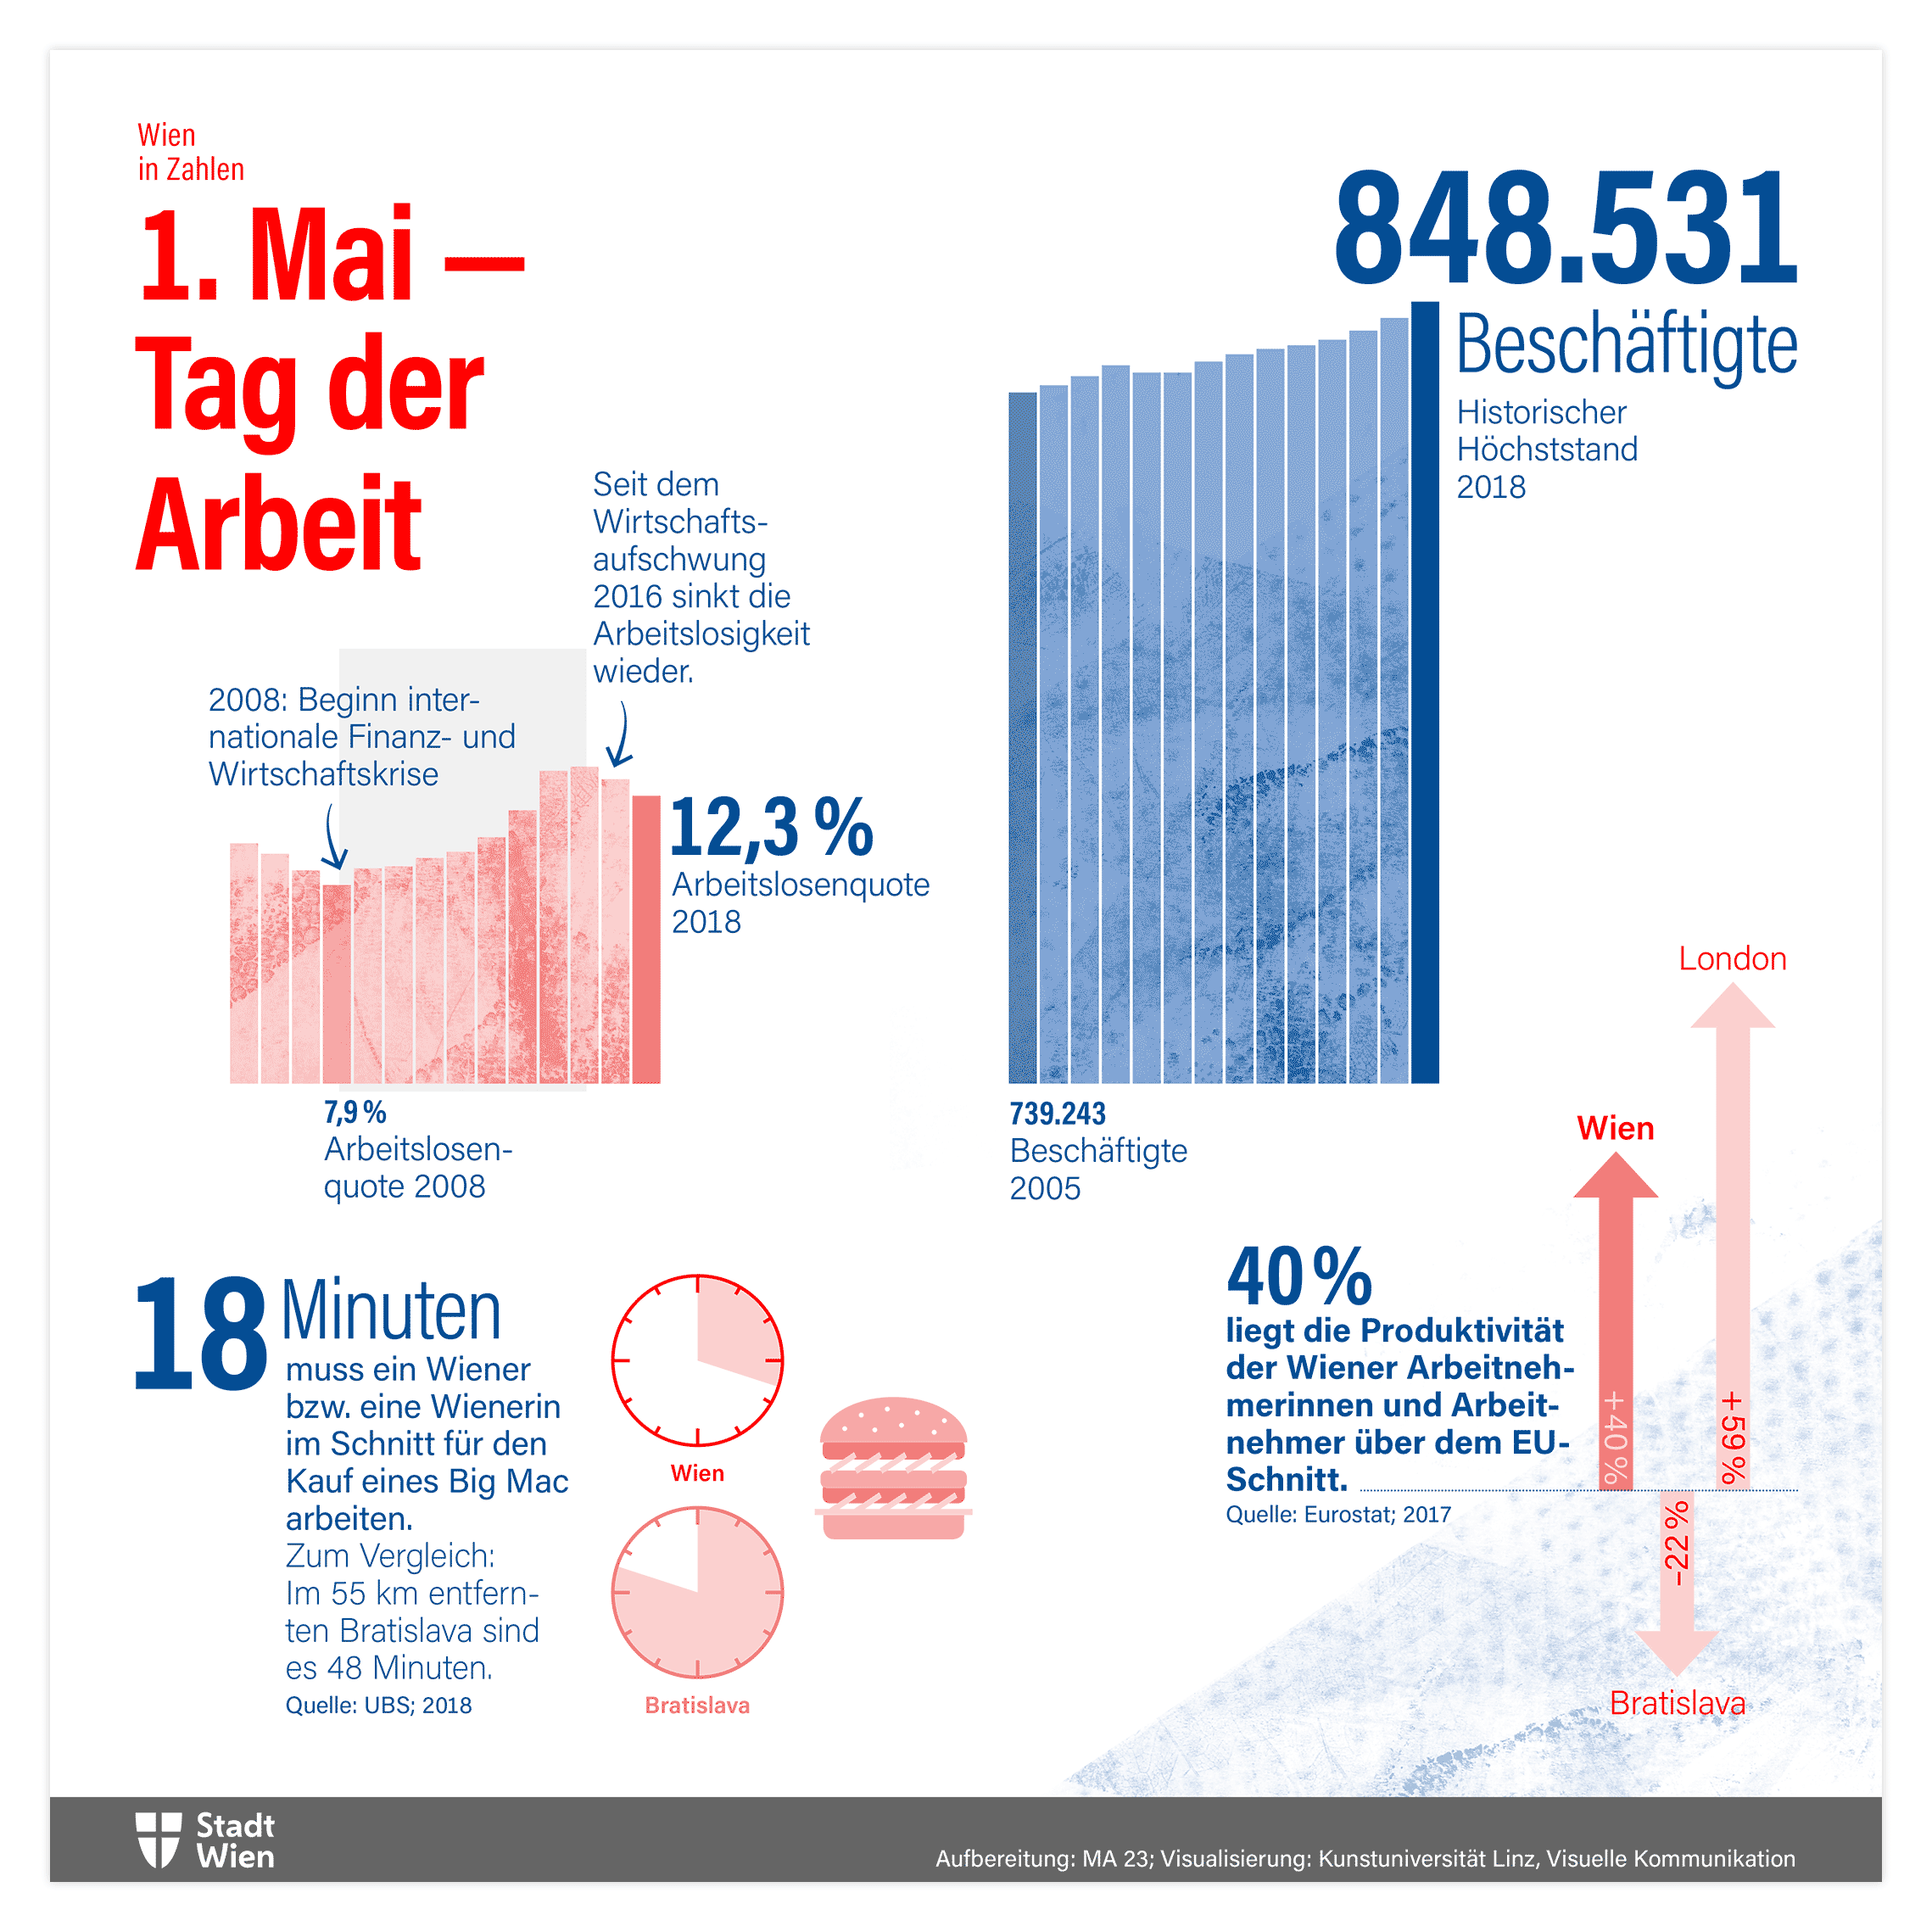
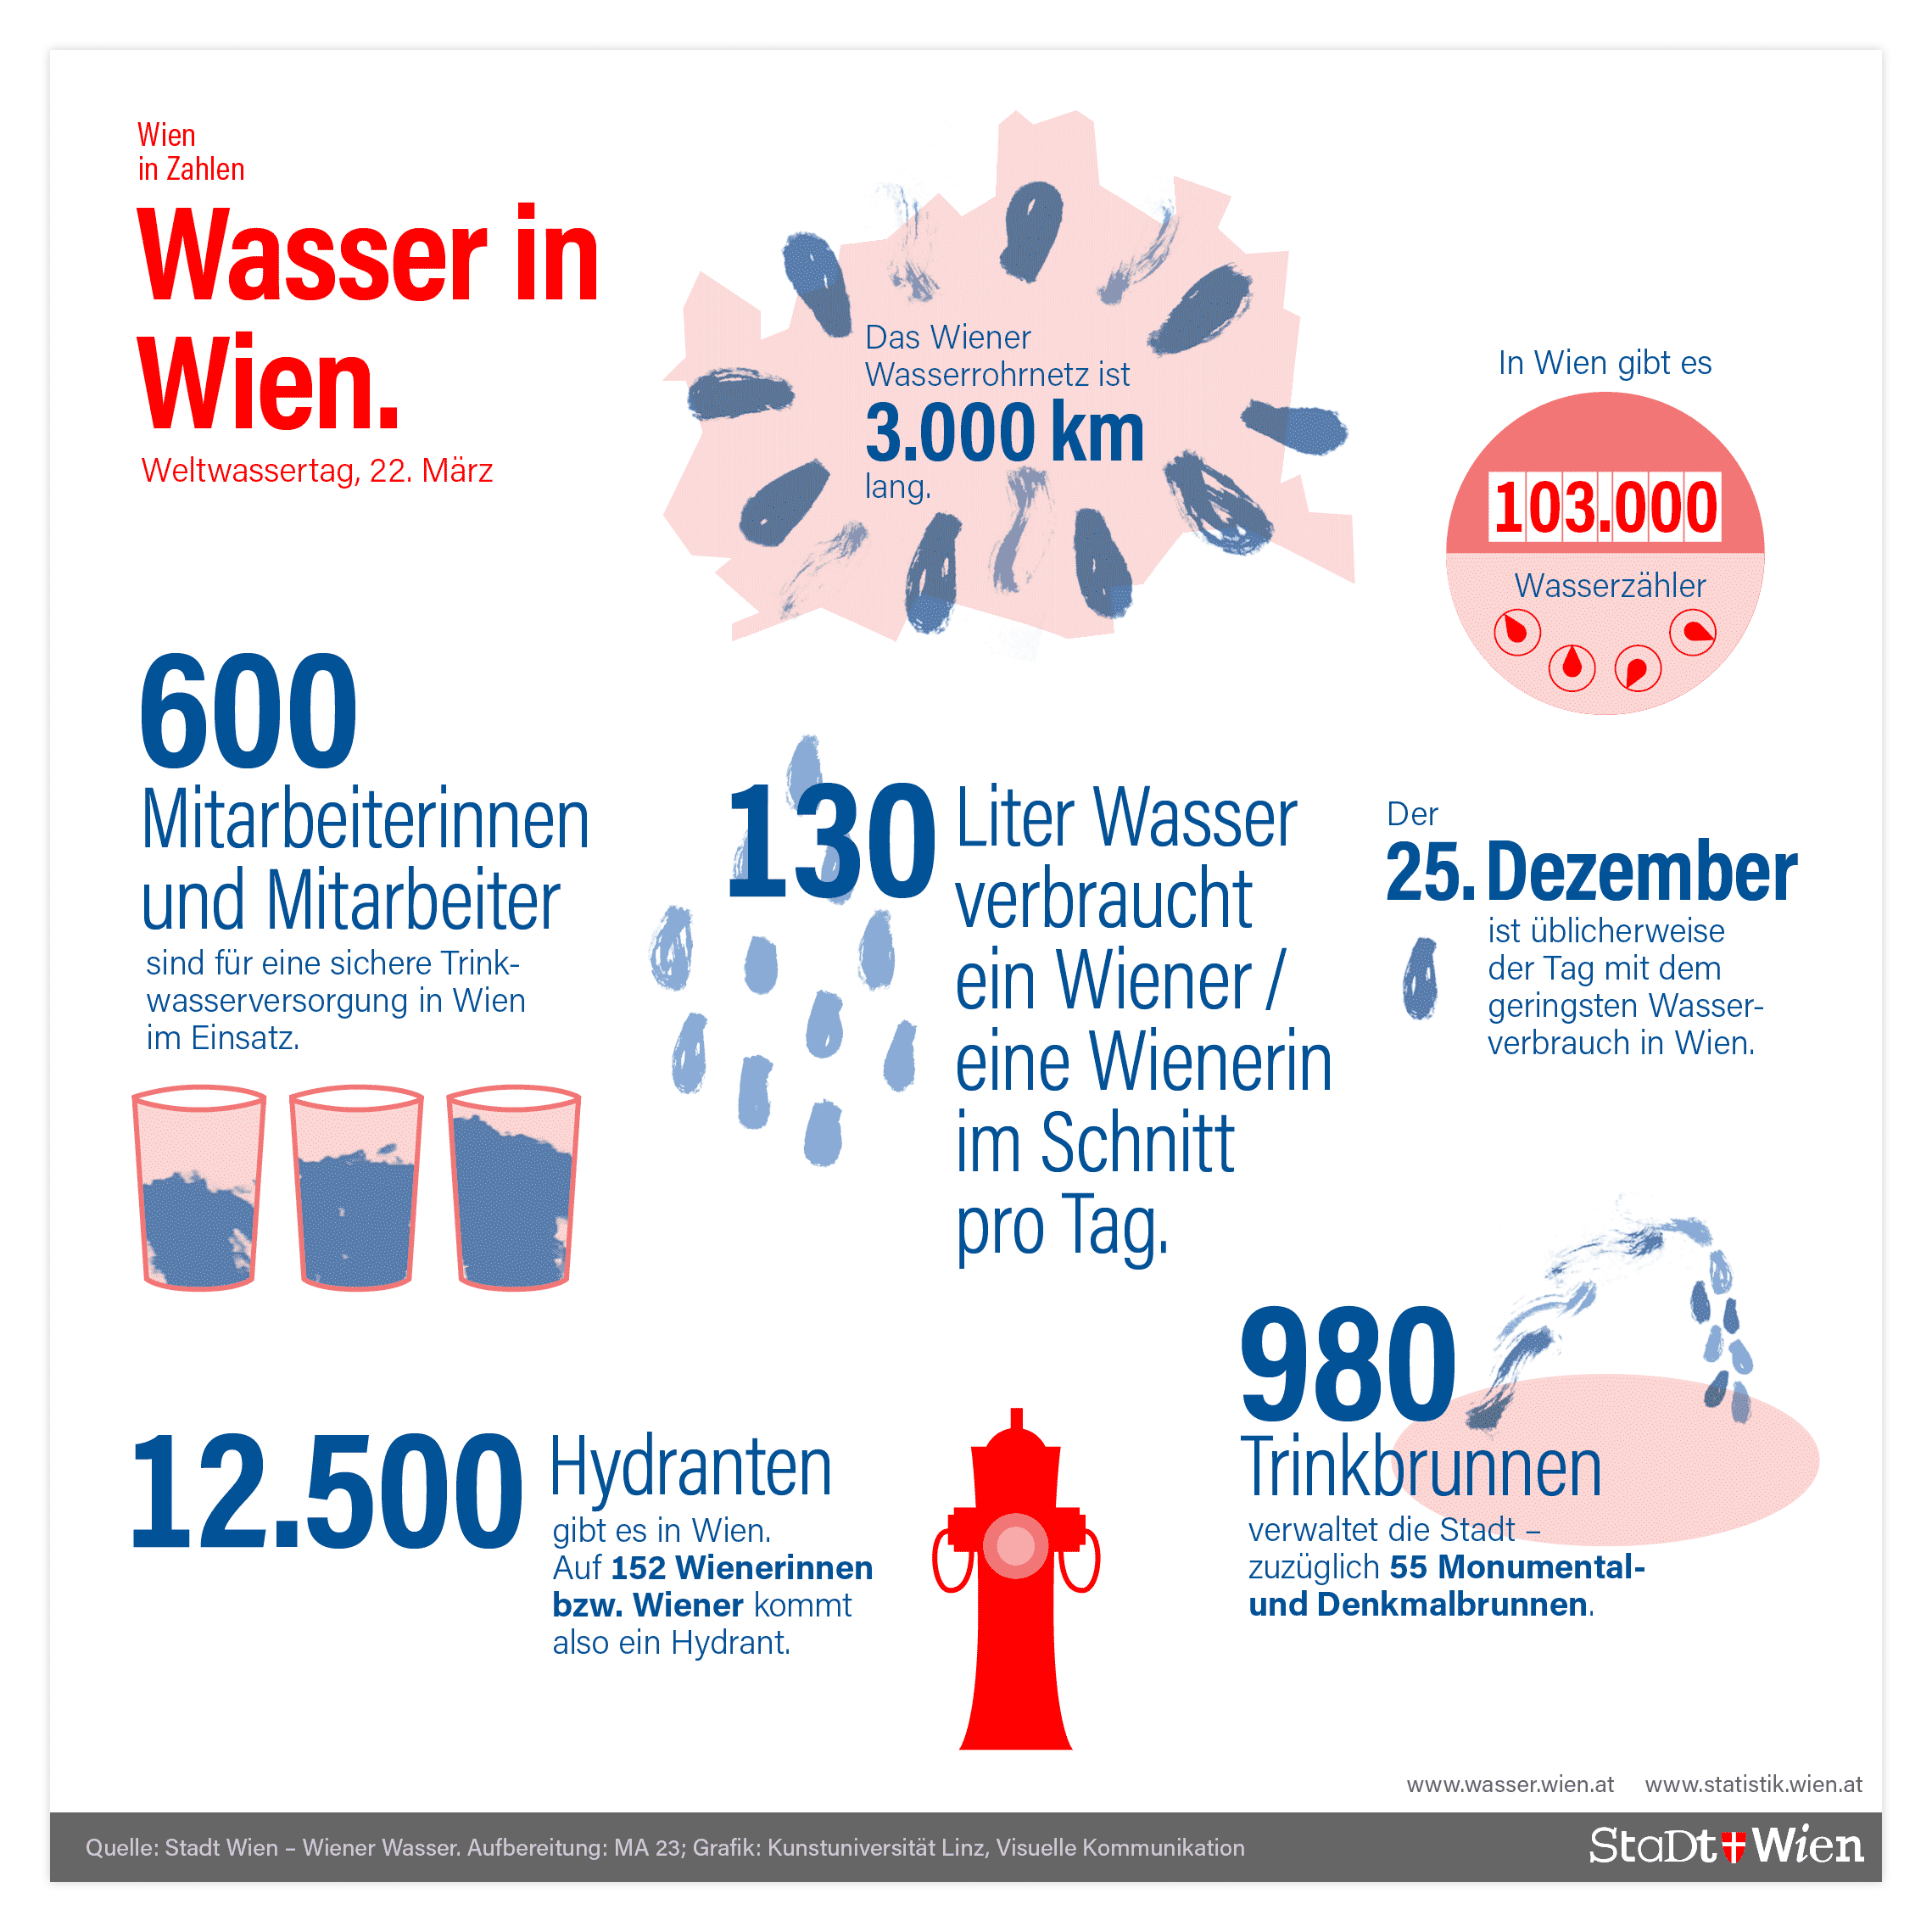
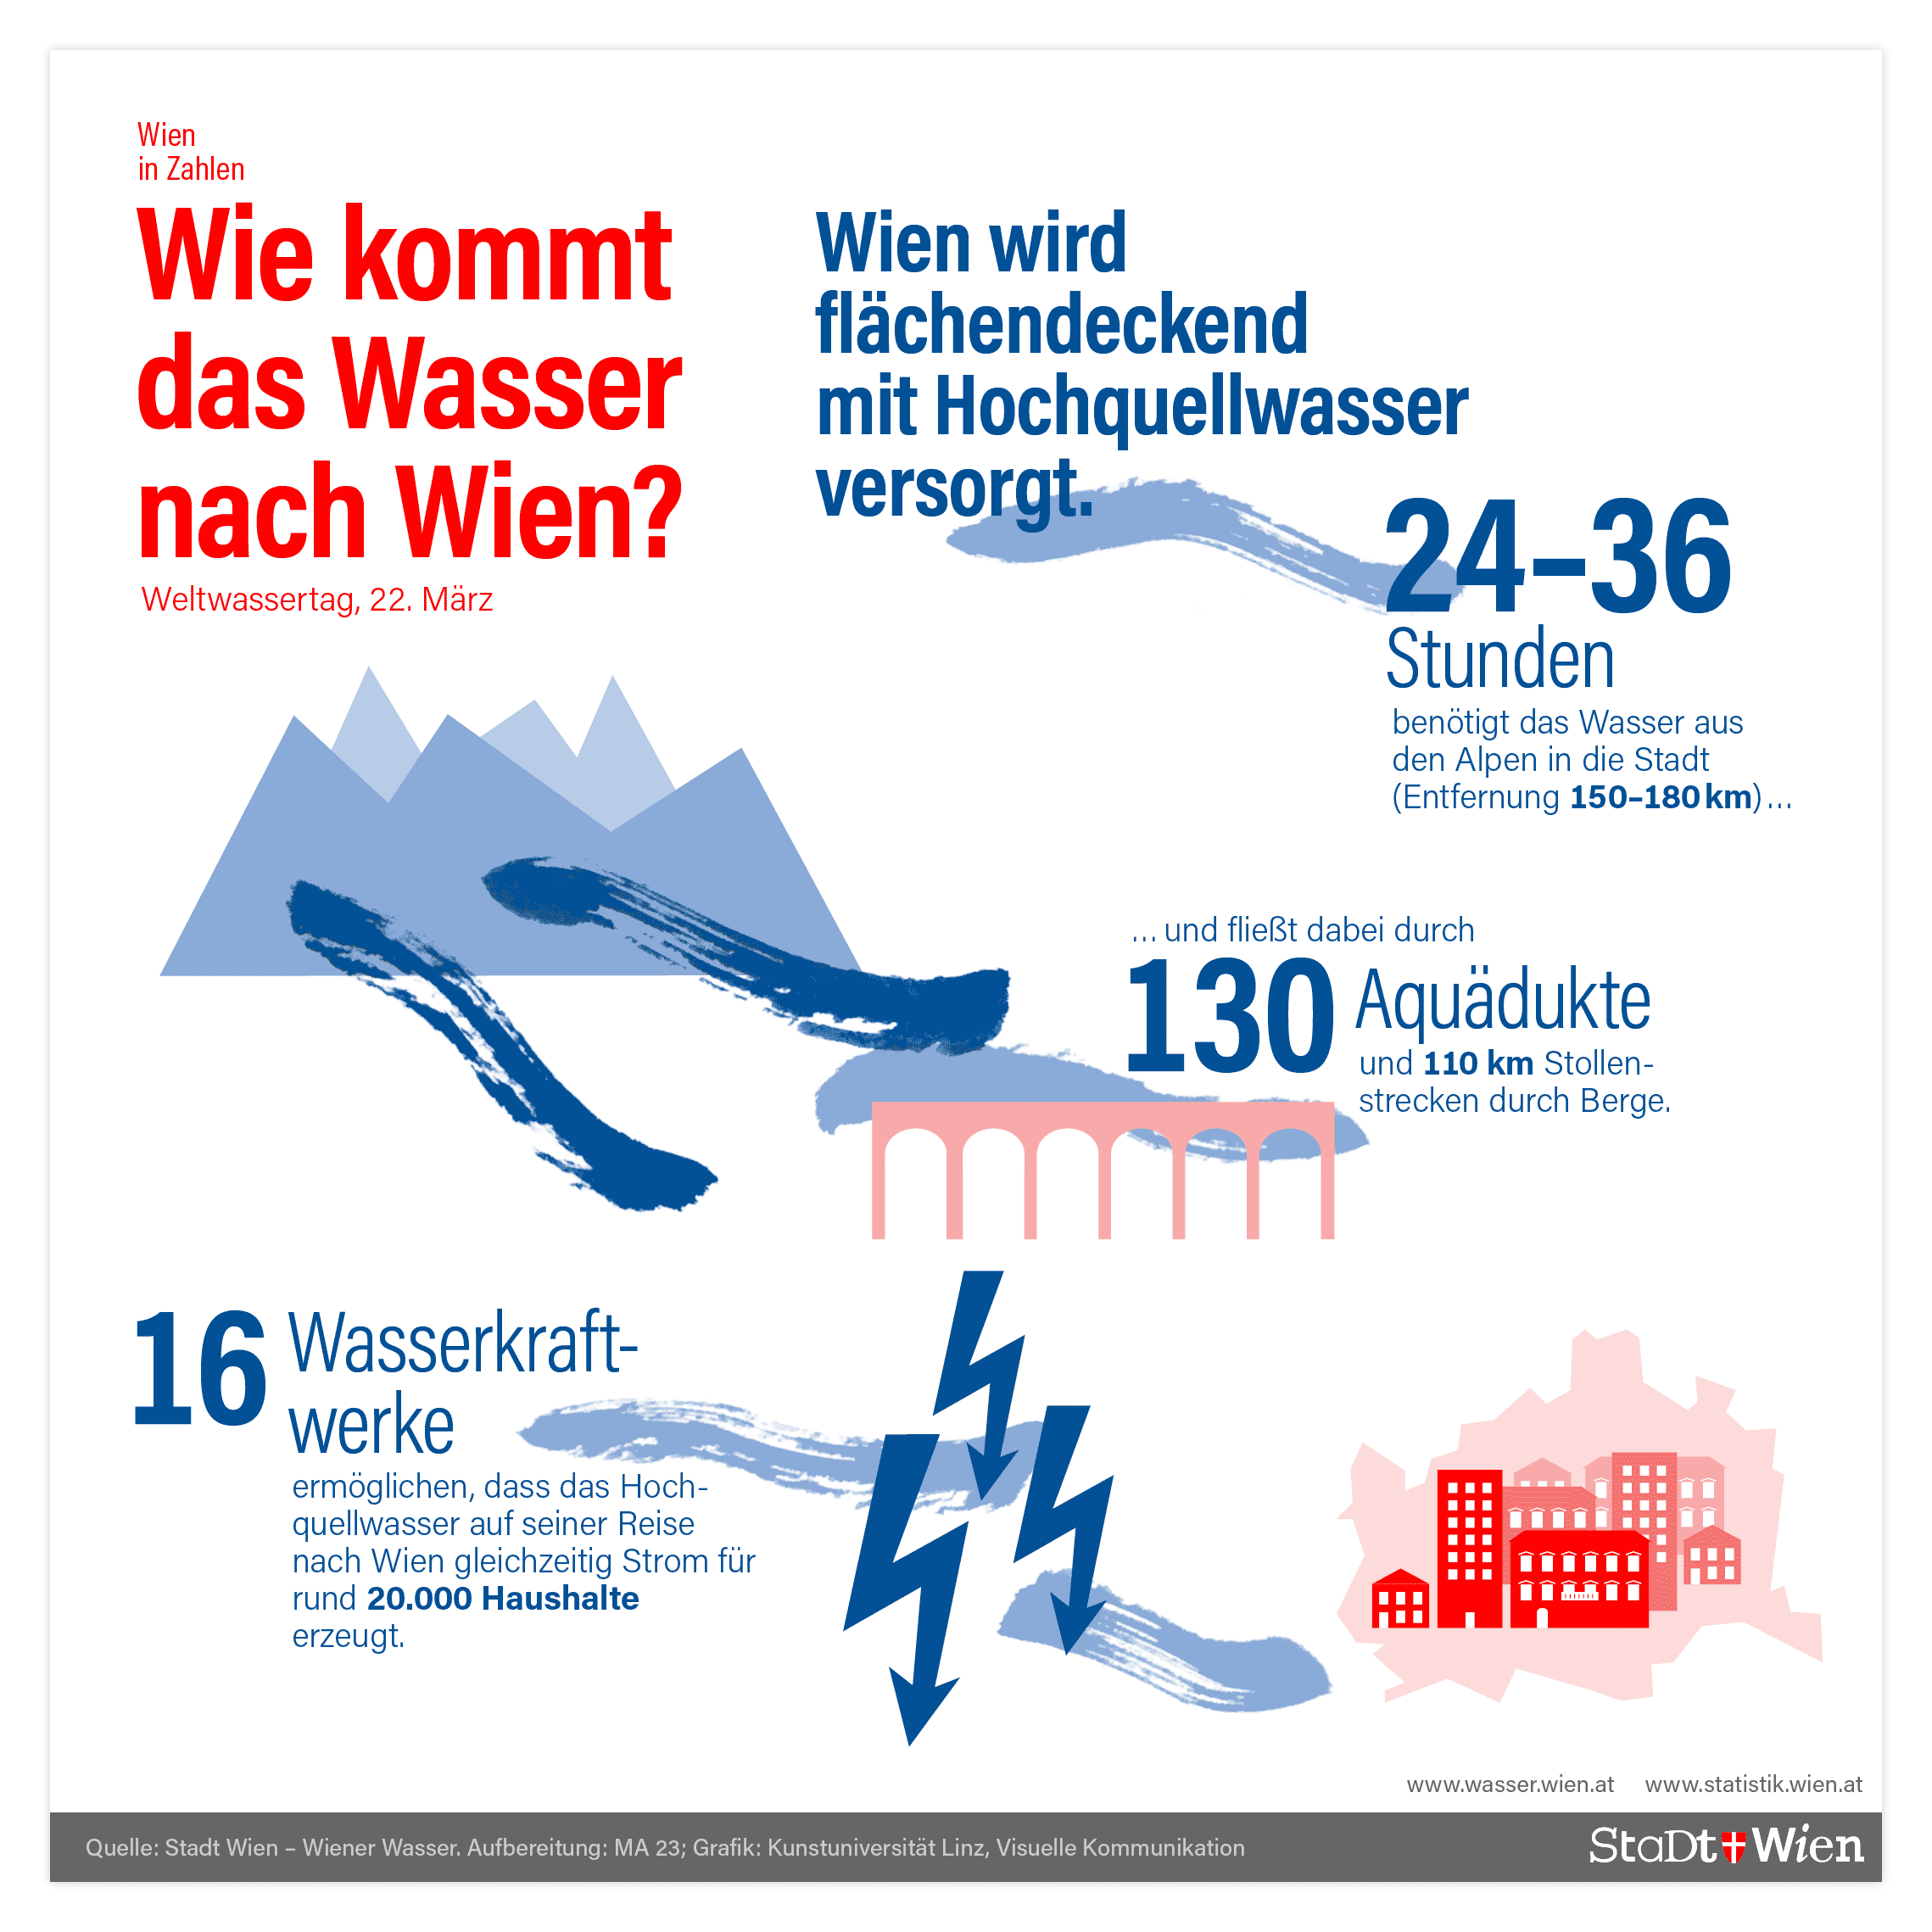
2019: illustrated infographics adressing the topics of “1st of May”, “Health system in Vienna”, “Water supply in Vienna”